
GraphXLo - Graph your XLoBorg from Python
So you have just gotten your hands on an XLoBorg, but you want to know what sort of data you can expect to see when using it, how can you tell?
Maybe a picture of what the data looks like would help.
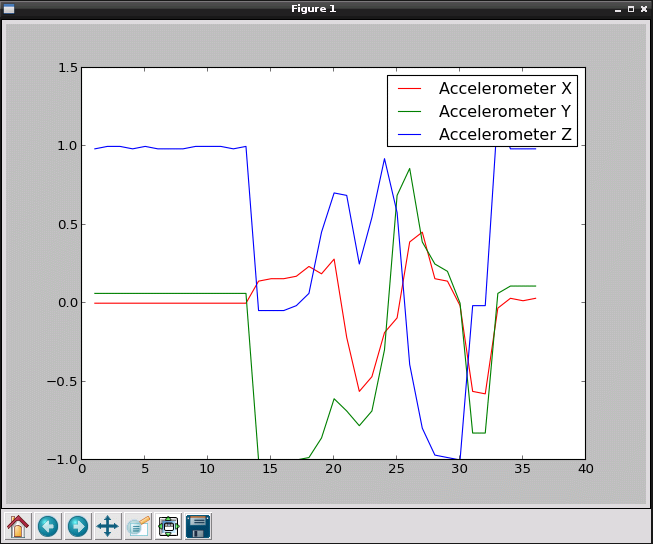
GraphXLo takes the data from an XLoBorg and draws it on the screen using a Python plotting library, matplotlib.
There are some options to configure from lines 5 to 19:
Here's the code, you can download the GraphXLo script file as text here
Save the text file on your pi as GraphXLo.py, in the ~/xloborg directory
Make the script executable using
then install matplotlib using
and run using
Maybe a picture of what the data looks like would help.
GraphXLo takes the data from an XLoBorg and draws it on the screen using a Python plotting library, matplotlib.
There are some options to configure from lines 5 to 19:
intervalis the number of seconds the script waits between updates, smaller numbers will produce a better graph but consume more processing powerplot...Colourare the colours used for each plot, configure to taste :)plot...are boolean (TrueorFalse) flags telling the script which lines to plot
Here's the code, you can download the GraphXLo script file as text here
Save the text file on your pi as GraphXLo.py, in the ~/xloborg directory
Make the script executable using
chmod +x ~/xloborg/GraphXLo.pythen install matplotlib using
sudo apt-get -y install python-matplotliband run using
~/xloborg/GraphXLo.py
#!/usr/bin/env python
# coding: latin-1

# Settings to control which data is displayed, and in what colours
plotAccelX = True                       # True to plot X G-force
plotAccelXColour = 'red'                # Colour for X G-force
plotAccelY = True                       # True to plot Y G-force
plotAccelYColour = 'green'              # Colour for Y G-force
plotAccelZ = True                       # True to plot Z G-force
plotAccelZColour = 'blue'               # Colour for Z G-force
plotMagX = False                        # True to plot X Magnetic flux
plotMagXColour = 'cyan'                 # Colour for X Magnetic flux
plotMagY = False                        # True to plot Y Magnetic flux
plotMagYColour = 'magenta'              # Colour for Y Magnetic flux
plotMagZ = False                        # True to plot Z Magnetic flux
plotMagZColour = 'yellow'               # Colour for Z Magnetic flux
plotTemp = False                        # True to plot temperature
plotTempColour = 'black'                # Colour for temperature
interval = 1.0                          # Time between updates, in seconds

# Import library functions we need
import time
import matplotlib.pyplot as plot
import XLoBorg
XLoBorg.Init()

print 'Press CTRL+C on the terminal window to finish'
try:
    # Generate the plotting window
    fig = plot.figure()
    plot.show(block = False)
    # Create the data arrays
    index = []
    aX = []
    aY = []
    aZ = []
    mX = []
    mY = []
    mZ = []
    temp = []
    i = 0
    # Loop indefinitely
    while True:
        # Read the latest data set
        i += 1
        index.append(i)
        x, y, z = XLoBorg.ReadAccelerometer()
        aX.append(x)
        aY.append(y)
        aZ.append(z)
        x, y, z = XLoBorg.ReadCompassRaw()
        mX.append(x)
        mY.append(y)
        mZ.append(z)
        t = XLoBorg.ReadTemperature()
        temp.append(t)
        # refresh the plot
        fig.clear()
        if plotAccelX:
            plot.plot(index, aX, color = plotAccelXColour, label = 'Accelerometer X')
        if plotAccelY:
            plot.plot(index, aY, color = plotAccelYColour, label = 'Accelerometer Y')
        if plotAccelZ:
            plot.plot(index, aZ, color = plotAccelZColour, label = 'Accelerometer Z')
        if plotMagX:
            plot.plot(index, mX, color = plotMagXColour, label = 'Magnetic flux X')
        if plotMagY:
            plot.plot(index, mY, color = plotMagYColour, label = 'Magnetic flux Y')
        if plotMagZ:
            plot.plot(index, mZ, color = plotMagZColour, label = 'Magnetic flux Z')
        if plotTemp:
            plot.plot(index, temp, color = plotTempColour, label = 'Temperature')
        plot.legend()
        fig.canvas.draw()
        # Wait for the next interval
        time.sleep(interval)
except KeyboardInterrupt:
    # User terminated with CTRL+C
    pass